Trauma registry data can detect poor outcomes, but it does not identify the root causes of quality problems. What if you could use data not only to flag performance improvement (PI) issues, but pinpoint the exact causes of low quality? According to Morad Hameed, MD, MPH and Larissa Roux, MD, MPH, PhD, the key is collecting “high resolution” trauma data.
Dr. Hameed is the Chief of the Section of Trauma and Acute Care Surgery in the Department of Surgery at the University of British Columbia. Dr. Roux is a sports medicine physician and health economist in Vancouver, British Columbia. The two are co-founders of T6 Health Systems, a technology company that has developed a powerful data collection and decision support system for trauma.
Dr. Hameed and Dr. Roux recently described how the T6 system generates data-rich “process maps” that could revolutionize trauma PI.
Q. What inspired you to tackle the problem of trauma data?
Dr. Hameed: Two things. First, both of us have done quite a bit of research using trauma databases and registries, and we often find that our research questions are very much limited by the detail of the data that is available. On the other hand, we all know that modern trauma bays are totally awash with data. There is data coming in from clinical assessments, from physiologic monitors, from labs, from radiologic investigations, etc. So there is a big gap between what data is generated in a high-intensity encounter like a trauma resuscitation and what data is captured in the registry.
Dr. Roux: And because of the complexity of maintaining a registry, the “resolution” of the data is often low. In addition, since many data elements are not collected in real time, there is an issue with accuracy.
Dr. Hameed: We recognized that the source of all our knowledge about trauma care is really the point of care. So our goal was to harness data generated at the point of care to produce actionable insights about patient care and process quality.
Q. Point-of-care data collection is a big challenge in trauma. How does the T6 system make it work?
Dr. Hameed: We have developed a unique mobile user interface that mirrors the true flow of trauma care. The interface is totally unlike an EHR. Intuitive tabs, touchpads and flow charts allow team members to enter data rapidly during a resuscitation.
Dr. Roux: At the same time, the system pulls data from the electronic ecosystem of the trauma bay. It can integrate data from physiologic monitors, radiology, lab reports and other data sources. On top of all that, every single data element is time-stamped. This is key, because time-stamping enables the system to generate detailed process maps.
Q. Explain process mapping.

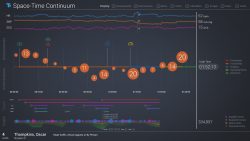
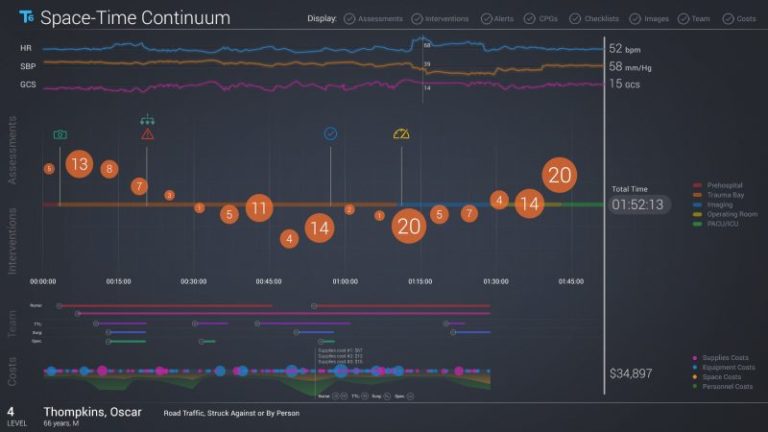
Dr. Hameed: We have always seen the process of trauma care as a continuum, and we have always seen it very spatially — the patient moves from the field to the trauma bay to the OR to the ICU to the ward. So we chose to visualize this data by creating a process map for every single patient. And we call this map the “Space-Time Continuum” out of our love for Back to the Future.
Dr. Roux: The Space-Time Continuum shows a patient’s journey along the continuum of care. It displays patient vital signs, assessment results, team interventions and other key milestones as the patient progresses along a timeline.
Q. How do trauma teams use process maps in actual PI activities?
Dr. Hameed: Let’s say your hospital has a time benchmark for getting head injury patients to a CT scan, and let’s say it’s 30 minutes. You find that most patients make it in under 30 minutes, but there are a few outliers. You can pull up the Space-Time Continuums for these outlier patients and look at all the potential points along the continuum where those delays might have happened. Then based on where you find the delays, you can figure out how to make improvements.
Dr. Roux: With standard trauma data, you would just know your success rate and which patients were outliers, but you would not know what aspects of the process were contributing to those delays. With these Space-Time Continuum data visualizations, you can understand precisely what went wrong with each of these cases and understand how to act on the data. That’s the difference between just having data and having actionable data.

Dr. Hameed: It can be even more powerful when you “stack up” the Space-Time Continuums for multiple patients. Then you can interact with the data, filter it and delve deeper.
For example, say you feel there have been some delays in access to your massive transfusion protocol. You can go into the system and select all your massive transfusion events for the last year, and you’ll get a series of Space-Time Continuums for all these patients. In the aggregate view, you will be able to see when blood products arrive and when they are transfused.
That will allow you to get an understanding of the supply chain and see where the delays are coming from. Is it a delay in arrival of blood from the blood bank? Or are red blood cells arriving quickly but not plasma? Or is the resuscitation very slow to reach a 1:1:1 ratio? Or is it the massive transfusion protocol not transitioning to the OR when a patient moves there? You will be able to see the answers in the Space-Time Continuum for this subset of patients.
Dr. Roux: The system lets you pinpoint the bottlenecks so you can really focus your performance improvement. You can make a change to your processes and then use T6 to see immediately whether the change made a difference.
Q. The system also captures cost data.

Dr. Roux: Yes! Since T6 links every discrete interval of the continuum of trauma care to detailed cost data in real time, trauma teams can at last begin to get new insights into the true costs of what they do. Health care systems usually collect data on what they charge, but much less is known about costs, or how to contain them. Linking process maps to accurate cost data, a method known as Time-Driven Activity-Based Costing (TDABC), is a critical first step toward improving the value of health care.
Dr. Hameed: Exactly. T6 process mapping and TDABC give us actionable insights about both quality and value in real time. With payment reforms that emphasize the value of healthcare provided, mapping processes, costs and outcomes is becoming essential to hospitals’ financial viability.
Q. Could you give a practical example of how cost data in process mapping would be useful?
Dr. Hameed: Say you are looking at “time to CT” in your facility. You pull up the aggregate Space-Time Continuum for all patients who have had a CT study over the past year. It not only tells you exactly how many minutes patients had to wait for the scanner to be available, it shows you precisely what the associated costs are — the critical care staff who waited with the patient, the cost of clinical space, etc.
The system lets you understand where you are improving the patient’s condition and where you are just incurring costs. You can then use that information to understand where process changes or other interventions can reduce your costs while maintaining, or even improving, outcomes.
Dr. Roux: This is just one small example of what we believe is a transformative way to use point-of-care data to improve health system performance and value. The fact that T6 generates and analyzes these process maps in real time, for every patient, means that trauma teams and hospitals can find ways to relentlessly reduce variance, improve quality and optimize value.
Want to know more? To find out how T6 uses point-of-care data capture and predictive analytics to promote efficient, high-quality care and maximize operational and financial performance, visit our website. To request a private demo for your trauma leadership team, click here.

