The Trauma Quality Improvement Program (TQIP) was launched in 2009, and for the first nine years it was completely voluntary. However, as of January 1, 2017, participation in TQIP is a requirement for all trauma centers verified by the American College of Surgeons (ACS). That means there are a lot of trauma leaders out there who are just getting started with this exciting program.
When you receive your first TQIP Benchmark Report, it can be a little overwhelming. Our facility — an ACS-verified Level II trauma center in Colorado — has been submitting data to TQIP since 2013. I still recall the first time I received our Benchmark Report. After reading through page after page of data, my first thought was, “Now what?”
It can feel like a daunting task to review all the information and determine what to focus on as an opportunity for improvement. But it is important to keep in mind that you do not need to fix everything. Select one or two areas for improvement. If you can begin improving your processes incrementally, you will ultimately improve the care you provide to patients. All you need is a starting point.
Begin by understanding the data
Reading a TQIP Benchmark Report is pretty easy once you know the basic concepts. There are also many useful resources available on the TQIP Education Portal. In my experience, the best place to start is the TQIP box-decile figure.
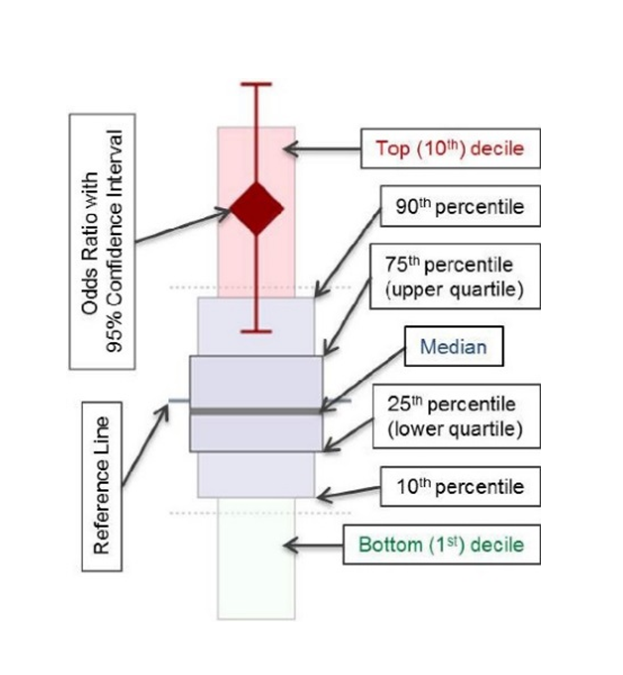
Box-decile figures in the Benchmark Report indicate the odds that a patient in your trauma center will experience a certain outcome.

- The y-axis of the figure is the risk-adjusted odds ratio for that outcome, centered at “1”.
- The large diamond indicates your hospital’s odds for a given outcome for a given patient cohort — for instance, the risk-adjusted odds of mortality among TBI patients.
- The boxes indicate which percentile your center falls in for that cohort. The lower your percentile, the better your outcomes compared to other facilities.
- The lines extending up and down from the diamond indicate the 95% confidence interval (CI).
- If your diamond and your CI lines are entirely below “1” on the chart, your patient outcomes for that cohort are statistically better than all other TQIP facilities.
- However, if your diamond and CI lines are entirely above “1”, your outcomes for that cohort are statistically worse than all other facilities.
One thing to keep in mind is that the Benchmark Report reflects the data you submitted. If there were errors in your data submission, your report may look funny.
When I opened up our facility’s first Benchmark Report several years ago, the first thing to catch my eye was “unplanned admission to the ICU.” The benchmark for all hospitals was 1.9 and our result was 4.3.
Were we really that far behind other hospitals? After further investigation, we discovered we had not been following the correct National Trauma Data Standard (NTDB) Data Dictionary definition for this field. So as they say, “garbage in, garbage out.”
This experience provided a great education opportunity for our program staff. We updated our data, and our next Benchmark Report showed our unplanned ICU admission rate as less than all other hospitals. More importantly, our data was accurate.
Use high outlier results to guide PI priorities
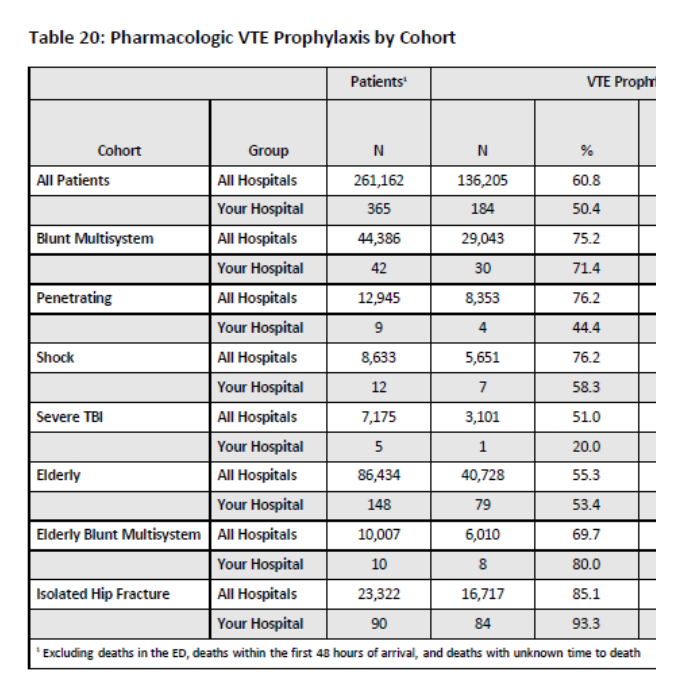
Unfortunately, not every poor TQIP result is just a data problem. One of our early Benchmark Reports showed us that we had an opportunity to improve venous thromboembolism (VTE) prophylaxis. On this measure, we were below other facilities in all patient cohorts other than elderly blunt mechanism and isolated hip fracture.

Our first step was to involve the key stakeholders in this issue — our trauma liaisons for orthopedics, neurosurgery and intensive care. We shared our TQIP results and the group discussed potential causes.
This is where the TQIP Patient Listing Application (also known as the “patient drill-down tool”) can be extremely useful. This tool allows you to do a deep dive on a seemingly endless number of data points. For example, you can select all deaths or all patients with a certain injury or a certain complication. You can then use the tool to look at all the elements that relate to that subset of patients, including complications, comorbid conditions, admitting service, outcome, etc.
Ultimately, our VTE prophylaxis stakeholder group determined the issues were lack of communication and failure to clarify which service was responsible for both initiating prophylaxis and re-initiating prophylaxis if it was stopped.
Our action plan involved updating our VTE prophylaxis guideline. We included the following language: “Dosing is the responsibility of the consulting surgical surgeon for initiation and continuation post-surgery.” This guideline was taken to all physician service line meetings for approval and education.
We received our next TQIP Benchmark Report six months later, and it showed improvement in VTE prophylaxis in every cohort. As a trauma program, we continue to monitor for fall-outs and report the information during our monthly trauma PI committee meeting. We still have room to improve, but we are making consistent progress.
Use low outlier results to build on your program’s strengths
The great thing about TQIP is that it is not just about correcting poor performance. Trauma program leaders can use their Benchmark Report to identify processes that are already working well and take them to new levels of quality.
My colleagues and I are currently using our program’s TQIP Benchmark Report to drive a new PI process for patients with isolated hip fracture.
Here’s the background: Current guidelines recommend that hip fractures be repaired within 24 to 36 hours of injury. Earlier surgery is associated with better functional outcomes and lower rates of perioperative complications and mortality. Advocates also argue that early surgical intervention minimizes bed rest time, reducing the risk of associated complications such as pressure sores, deep vein thrombosis, pneumonia and urinary tract infection.
According to a recent Benchmark Report, our result for “operative fixation more than 48 hours” for isolated hip fracture patients falls below the benchmark for all other facilities. Still, the report showed us that it takes longer than 48 hours to provide surgical fixation to 21% of our isolated hip fracture patients. Based on these results — and the emerging consensus that earlier surgery is preferable — we decided we had an opportunity for improvement.
Using the TQIP Patient Listing Application and our patient medical records, I performed a retrospective review of 6 months’ worth of data. Demographic data points included age, arrival time, arrival day of week, operative start time, operative day of week, time to medical optimization and co-morbidities. Outcome measures included post-operative complications, average hospital length of stay, cost and mortality.
I separated the isolated hip fracture group into patients taken to the OR in less than 48 hours and those who went in greater than 48 hours. Then I drilled down to see what was the common cause for delay in surgery beyond 48 hours. Based on information in the medical records and physician dictation reports, I identified “medical optimization” as the common reason for delayed surgery.
This spurred a research question: How can we as a trauma center optimize the care of isolated hip fracture patients requiring operative fixation who are in need of medical optimization?
Once the data was collected, the results were shared with the trauma medical director and the orthopedic liaison. Both agreed this was an opportunity for improvement. The data was then presented to the orthopedic, emergency room physician and inpatient service line committees. All agreed to participate in developing a process to get this specialty population to the OR in less than 48 hours.
Our new process was implemented on May 1. It focuses on:
- Strengthening communication between medical providers and orthopedic surgeons
- Ensuring the availability of OR resources
- Enabling early identification of hip fracture patients requiring operative fixation
- Ensuring medical optimization occurs within the first 12 to 24 hours
We plan to perform a retrospective review later this year to determine whether our initiative was successful. Our main success measure will be time to operative fixation for this patient population. Will our new process reduce the time we take to get patients to surgery? We will also look at the impact of this process on hospital length of stay and overall healthcare costs.
One step at a time
The TQIP Benchmark Report is a powerful tool for identifying PI opportunities and planning PI interventions. The important thing is to take it one step at a time. Steady gains will eventually add up to significant improvements in quality, outcomes and patient safety at your trauma center.
Tracy Lauzon, MSN, BSN, RN, CNML is director of trauma services/registry analyst at the Medical Center of Aurora in Aurora, Colorado. She is also a site reviewer for the American College of Surgeons and the State of Colorado.

